Documentation Index
Fetch the complete documentation index at: https://domoinc-arun-raj-connectors-domo-479695-remove-crime-report.mintlify.app/llms.txt
Use this file to discover all available pages before exploring further.
Intro
The packed bubble chart allows you to visualize and compare data by relative size. This chart combines the functions of word clouds and bubble charts without the need for x and y axes.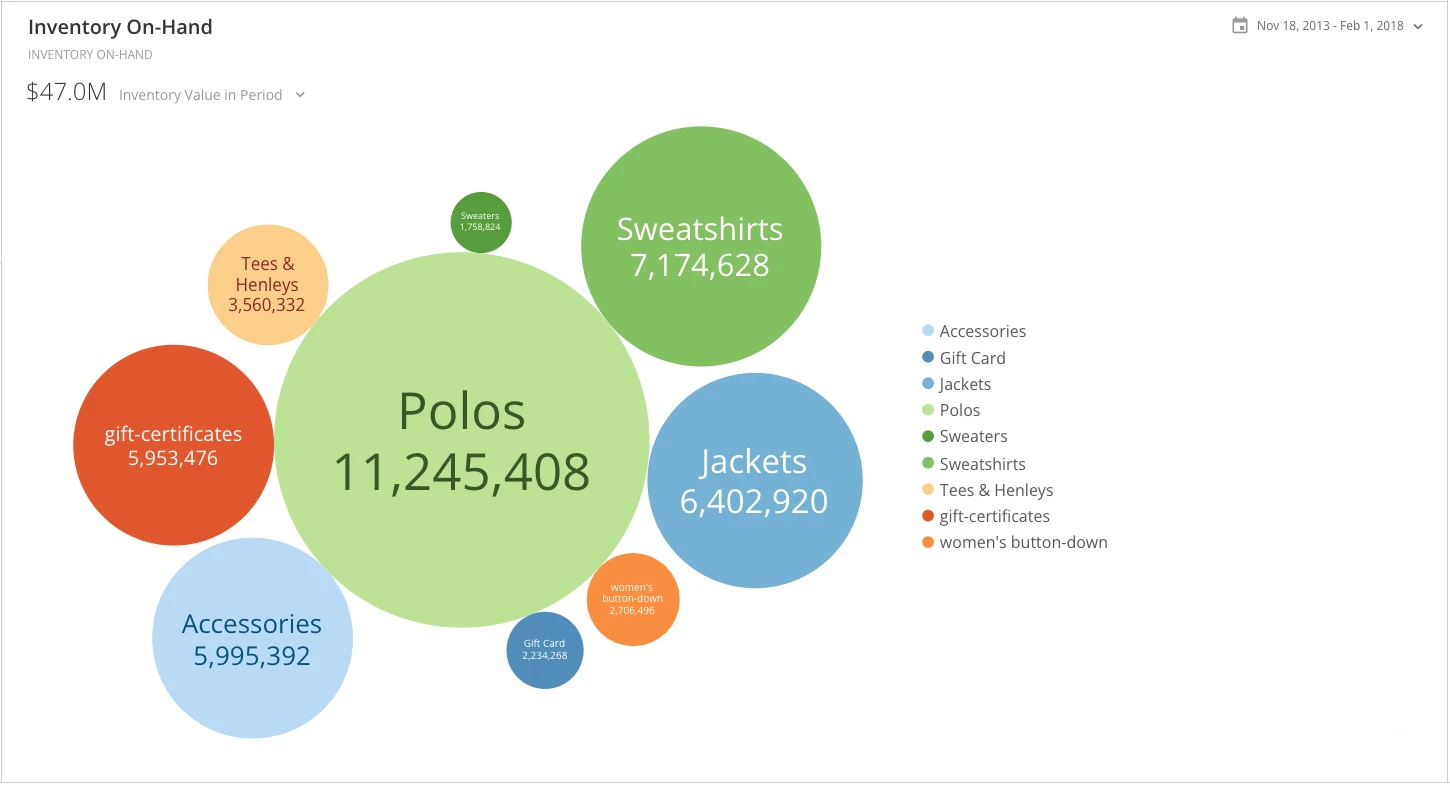
Powering a Packed Bubble Chart
A packed bubble chart requires the following:- Names — A name for the value that displays in each bubble.
- Values — The values that correspond to the names inside each bubble.
- Series — How the names are grouped.
